Working the Pipeline report
Where pipeline comes from, how it moved, and how it closed — four reports that make a weekly pipeline review something other than a spreadsheet.
Three questions, four reports
Pipeline answers the three questions every RevOps cadence has to answer. Pipeline Source: where is pipeline coming from. Pipeline Movement: how did it change this period, and why does this quarter look different from last. Then the outcome half, which the product splits into two reports rather than one — Won Deals and Lost Deals: how is it actually closing.
Each is a standalone report with its own card on Reporting and its own route, so the agenda is a set of links rather than a page you scroll. Used that way it is a thirty-minute review with a defensible shape: generation health, then in-quarter mechanics, then outcomes. Set fiscal year, quarter and team first in each; every KPI and chart reflects the active scope.
Pipeline Source is an investment decision
Pipeline Source puts total pipeline, win rate, average time to close and velocity together across every acquisition channel. That combination is the reason to come here. Volume alone tells you where pipeline came from, and volume with win rate and cycle tells you where the next generation dollar should go.
The trap it is built to expose: a channel producing a large share of pipeline amount at a win rate below your segment average is manufacturing coverage, not revenue. It looks like strength on a volume chart and costs you a quarter when the deals do not close. Flag any channel where contribution is high and win rate is below segment average, and treat that as a generation problem rather than a sales-execution one.
Pipeline Movement is the weekly review
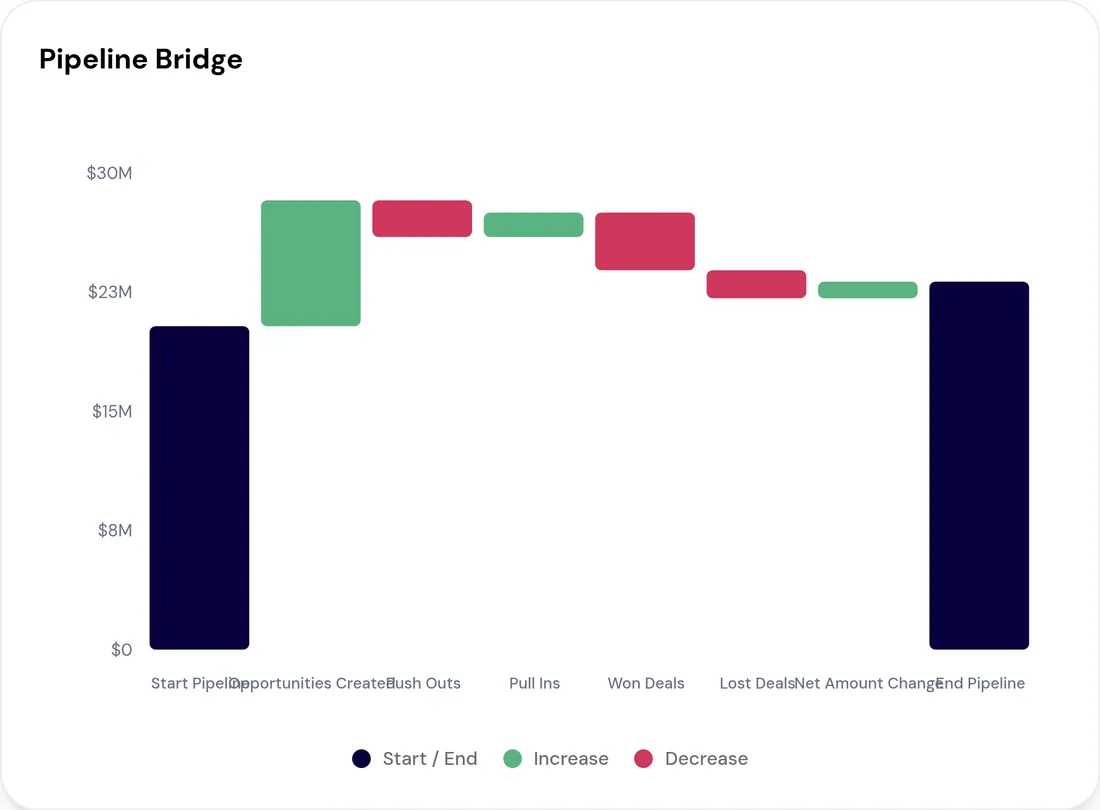
The Pipeline Bridge on Pipeline Movement is the single most useful object in the report. Read it left to right: opening balance, what was added (opportunities created, pull-ins), what was removed (push-outs, won, lost), net amount edits, closing balance. That sequence is your weekly agenda, already ordered.
Then do the thing that separates a review from a readout: click the largest red bar and triage the deals inside it. Every step on the bridge opens the deals behind the number — and the list reuses that step's exact filter, so it always sums to the bar you clicked. A push-out figure is a statistic; the eleven deals inside it are a conversation with names attached.
Won and Lost, read honestly
The post-mortem half is two reports, not one: Won Deals and Lost Deals. Each carries its own revenue, win rate, average deal size and a filterable table of the deals behind them, with the CRM's own close reason on every row — enough to defend a renewal forecast, a territory question or a quarterly debrief.
Average sales cycle is measured per report — won deals on Won, lost deals on Lost — which is exactly why the pair is worth reading together. A win-rate jump that arrives with a longer cycle on Won is not automatically good news. It can mean you are over-qualifying and walking away from deals you would have won. Compare both against the prior period before drawing a conclusion from either.
- Open Lost Deals for the last thirty days and read the loss reasons, not the count
- Bring the top three to the next forecast call rather than the next QBR
- The URL carries your filters — paste it into the meeting invite so everyone opens the same view
Making it a rhythm
Pipeline pays off as a standing agenda rather than a page you visit when the number looks wrong. One pass per team: Pipeline Source for generation health, Pipeline Movement for in-quarter mechanics, Won and Lost Deals for outcomes.
The mechanical habit that makes it stick is copying the URL of the report you end on into the next meeting invite. It removes the two minutes at the start of every review where somebody re-applies filters from memory and gets them slightly wrong.
What to take away
- Pipeline Source, Pipeline Movement, then Won and Lost Deals each answer one question. Use them as the agenda, in that order.
- A high-volume channel with a low win rate is a coverage trap, not a strength.
- Read the movement bridge left to right and open the largest red bar — that is the review.
- Won Deals and Lost Deals are separate reports. Read them as a pair — a win-rate move only means something next to the cycle underneath it.
Put it to work
Jobs this page is behind
Try the demo.
See agents carry the repeatable work of GTM across sales, marketing, customer success, and RevOps. Every action prepared, reviewed, and recorded. Fictional data, real product.
Explore the demo