Coaching from team performance
One row per person, one number that says whether they will hit the quarter. Built for the weekly 1:1, on both the sales and customer success sides.
One row per person
The team reports give you one row per rep or CSM and one number that tells you whether they will hit the quarter. They are built for the weekly 1:1 rather than the quarterly review, and that frequency is the whole design. A coverage gap found weekly is workable, and the same gap found quarterly is a miss you are reporting rather than preventing.
Scope the fiscal year and quarter to the period you are actually managing, then narrow to one segment. Comparing reps within a segment is useful; comparing across segments mostly measures the segments.
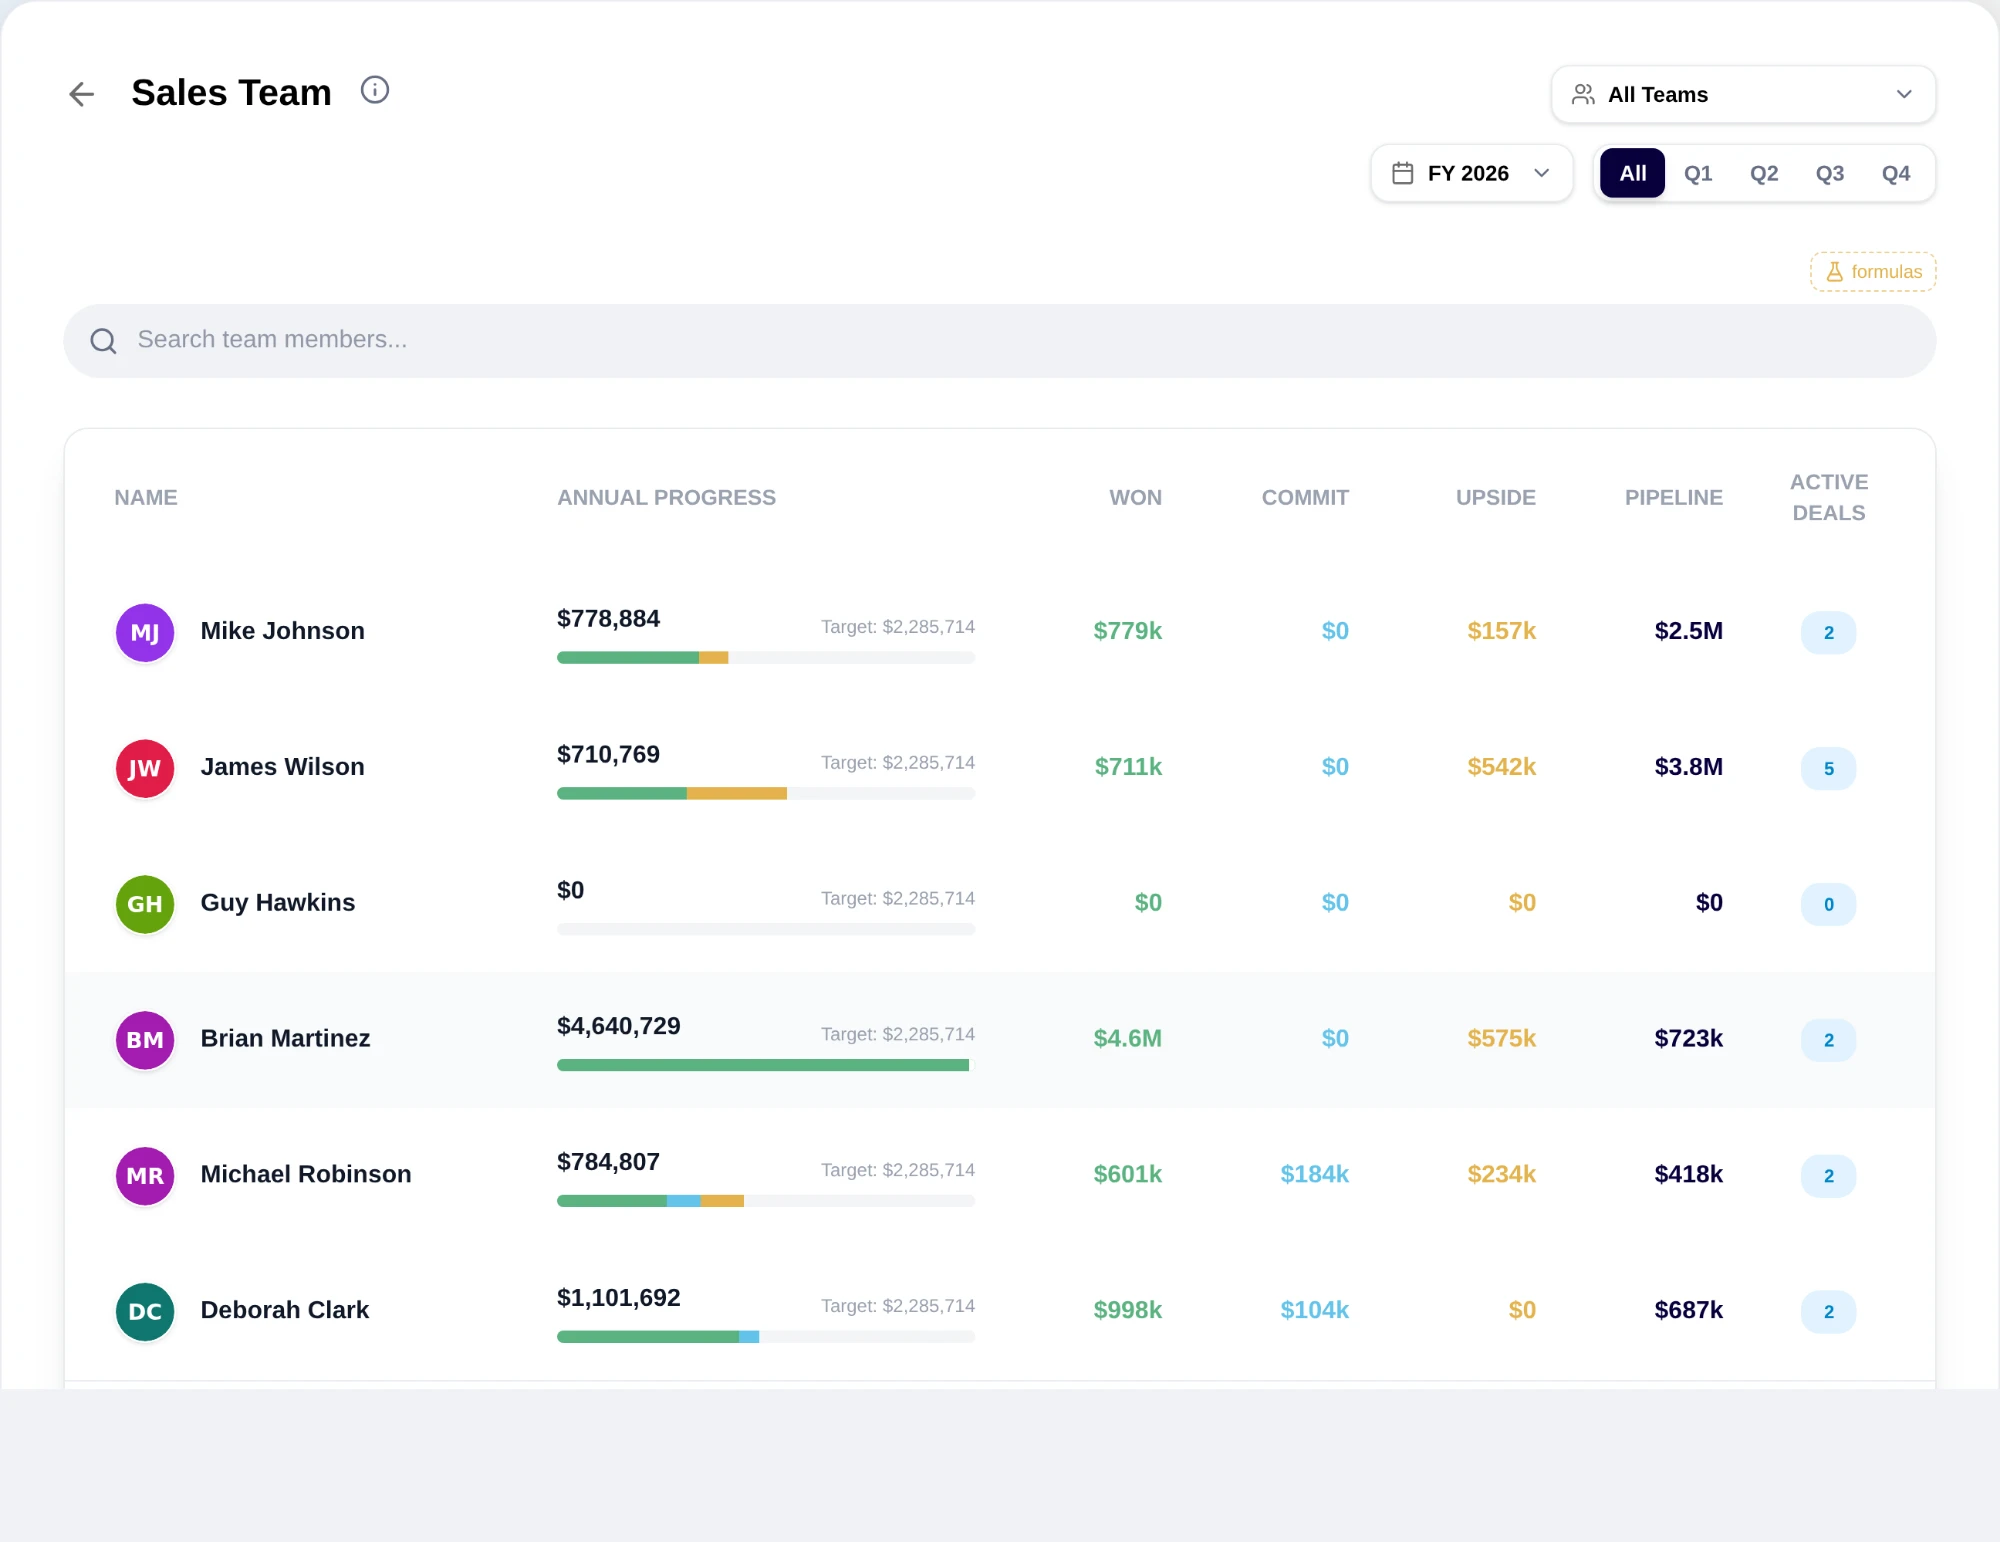
Reading the bar, and reading coverage
The stacked bar is Won, plus Commit, plus Upside, against target. Its shape is diagnostic. A short green section with a long blue and yellow tail means the rep is leaning on commit and upside, which is a conversation about deal quality. A short total bar means something different: not enough is in play at all.
Coverage is the check that separates those two. Compare open pipeline to the remaining gap, meaning target minus won. Below roughly 2×, the rep needs to add pipeline, and no amount of working the existing deals will fix it. That is a generation conversation, and having it in week three rather than week ten is the entire value of a weekly cadence.
Concentration risk
High pipeline value spread across very few active deals is high variance. It looks healthy on a coverage number and behaves badly: two slipped deals and the quarter is gone.
The important thing about this signal is what it is not. It is a coaching conversation about how the rep is building pipeline, not a reason to change their forecast. Cutting the forecast treats the symptom and leaves the rep building the same way next quarter.
The customer success side
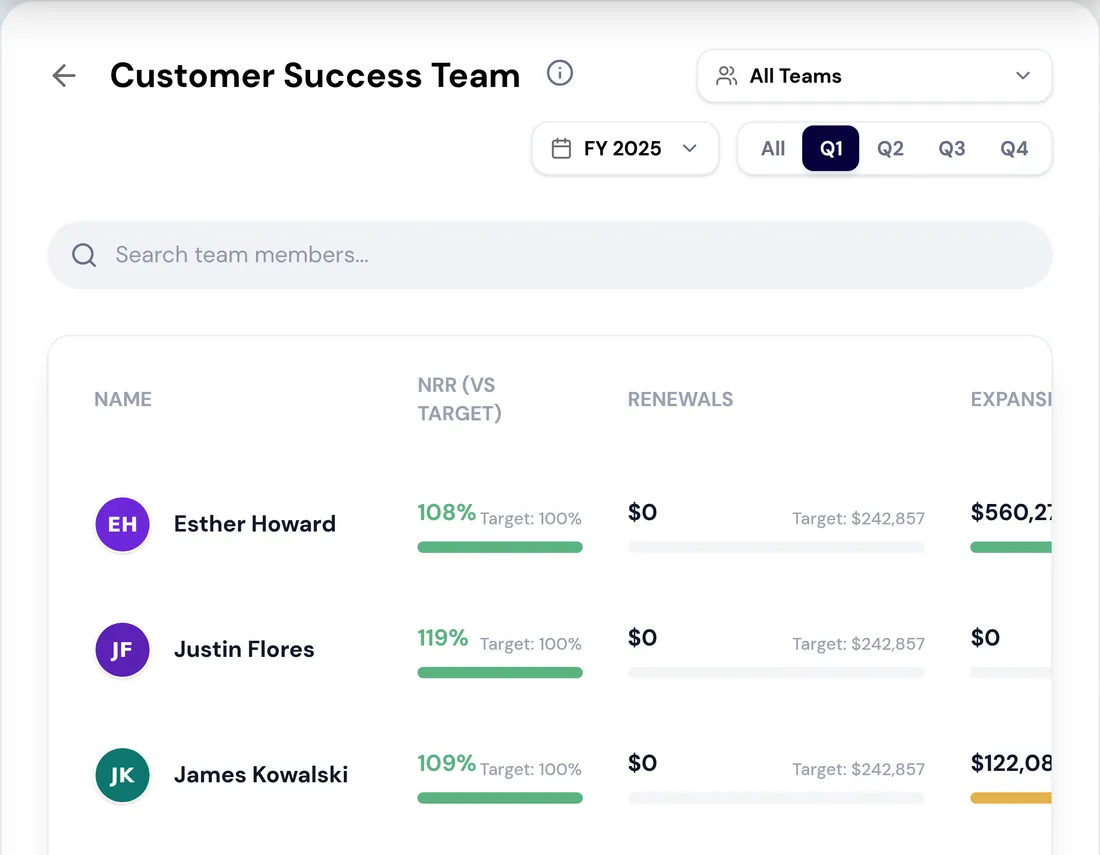
CS Team is the same shape for customer success: every CSM with NRR against target, renewals and expansion won versus still open, and the size of their book. Scan for the largest NRR gap; that is the highest-leverage coaching conversation of the week.
Drilling into one CSM opens Pipeline, Activities and Coverage. The renewal pipeline runs 90 / 60 / 30 days out through renewed or churned, and the 90 and 60 columns are where surprise churn actually gets prevented. A renewal first discussed at 30 days out is a negotiation.
Engagement shape as a leading indicator
QBRs, emails, check-ins and support tickets are leading indicators, and the activity chart shows the shape of the quarter: steady engagement, a last-minute scramble, or radio silence. The shape frequently predicts the renewal outcome before the renewal date does, which is only useful if somebody is reading it early.
The highest-risk pattern is a disengaged customer in a late renewal stage. Read engagement and renewal pipeline together, never separately.
Turning the read into work
Coverage is the CSM's full book, and it is where the read becomes work: multi-select at-risk customers, expansion candidates or a QBR cohort and push them into a list or a campaign.
The rhythm on both sides is the same. Scan the team view, drill into the biggest gap, walk the detail, act on the book, repeat next week. You end with a short list of people to inspect, a short list of deals per person, and a short list of activities to coach, which is a 1:1 agenda that wrote itself.
What to take away
- These reports are built for the weekly 1:1, not the quarterly review. Use them at that frequency or they are just a scoreboard.
- Coverage under roughly 2× the remaining gap is a pipeline problem, not an execution problem.
- High pipeline across very few deals is concentration risk — a coaching conversation, not a forecast change.
- On the CS side, engagement shape predicts the renewal before the renewal date does.
- Compare within a segment. Across segments the comparison is mostly noise.
Put it to work
Jobs this page is behind
- SellingRun a pipeline review in an hour“I want to run a weekly pipeline review that is a decision rather than a data-quality session.”
- Forecast and planSee who will miss before they miss“I want to know which of my people are going to miss while the quarter can still be changed.”
- CustomersReport retention from one place“I want to report retention and net revenue retention without assembling them by hand.”
Try the demo.
See agents carry the repeatable work of GTM across sales, marketing, customer success, and RevOps. Every action prepared, reviewed, and recorded. Fictional data, real product.
Explore the demo