Slide 1 of 4
The average hides the concentration
A book that is mostly healthy with a cluster of severe risk averages out to the same figure as a book that is uniformly mediocre. They need completely different work.
Read health as a distribution and net retention as four separate levers, so you can name what is actually moving instead of reporting an average.
On the Retention tab, Gross Revenue Retention is the highlighted headline card, showing how much of last year's ARR you kept, with Churn Rate, Revenue at Risk and Renewal Rate beside it. Below them sits the Retention Components chart, and its construction is worth thirty seconds: new and expansion revenue stack upward, contraction and cancellation stack downward, and the line running across the top is net retention. When that line dips below 100%, the stacks underneath tell you which lever did it.
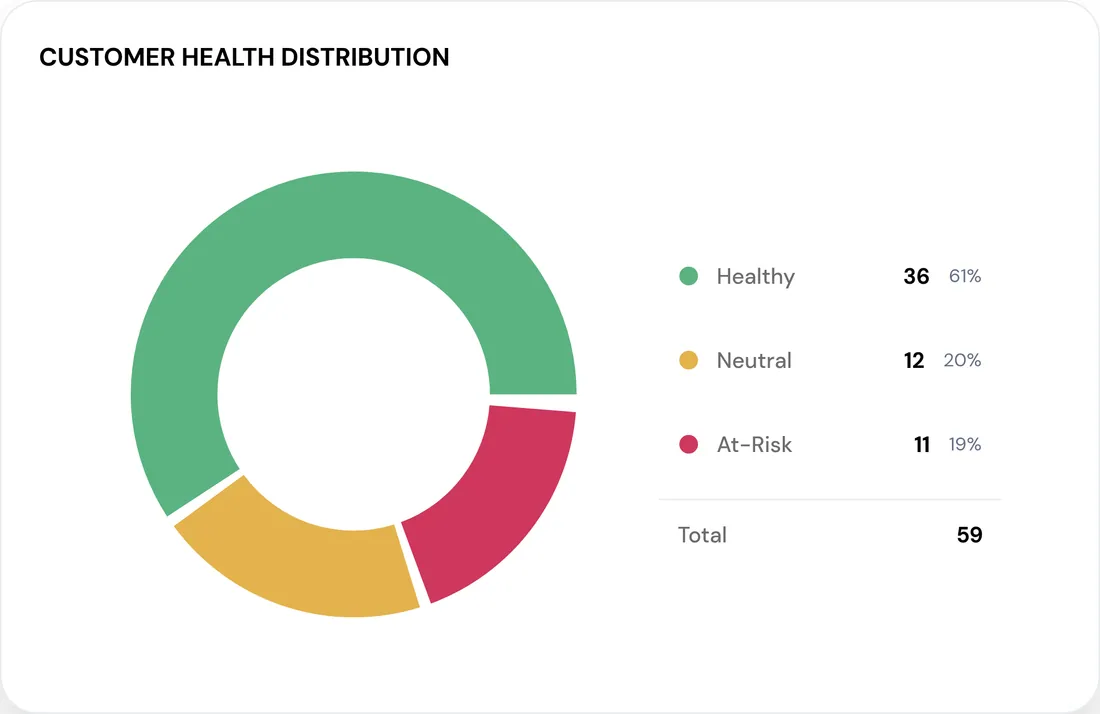
On the Health tab, the distribution chart bins the book into Healthy, Neutral and At-Risk. Both charts exist to stop you reading one average, and this lesson is the method for reading them properly.
Health distribution is presented as a distribution deliberately. Two books with identical average health can require entirely different work: one is broadly fine with a tight cluster of accounts in serious trouble, the other is uniformly unremarkable with nothing acute. The first needs a small number of urgent, senior interventions. The second needs a change to how the whole book is being run. An average describes both identically and points at neither.
Reading the shape takes seconds once it is a habit. Where is the mass, how long is the tail, and is the tail thickening over time? Those three questions produce a diagnosis; "average health is 68" produces a slide.
The same discipline applies to the number everyone reports. Net retention is not a primitive quantity. It is the net of those four movements, which is why the useful question is never "why is retention down" but "which of the four is doing it".
Each answer routes to entirely different work, and picking the wrong one costs you a quarter.
Account counts and revenue rarely agree, and the disagreement is where the risk hides. A book with ten small at-risk accounts and a book with one at-risk account carrying a fifth of the ARR can report the same at-risk percentage. Gross revenue retention is the headline figure precisely because it is weighted: it tells you how much of last year's ARR you kept, which is the question the business is actually asking.
Get in the habit of reading the count and the revenue side by side. When they point in the same direction, the picture is simple. When they diverge, the divergence is the finding: it usually means either a concentration risk sitting in one or two accounts, or a long tail of small accounts churning quietly enough that nobody has raised it.
Net retention comes in at 99%. Reported as one number it invites a shrug: near enough to flat, no obvious action.
Broken into levers it stops being flat. Expansion was strong, contraction was minimal, and a single large cancellation pulled the whole figure down by several points on its own. The book is performing well and one account left. Those are completely different management conversations from "retention is flat", and only one of them is true.
Now weight it by revenue rather than logos and a second thing appears. The canceled account was small in count terms and large in revenue, and there are three more accounts in the same segment with the same profile. The finding is not the 99%. It is that a segment you were not worried about carries concentrated revenue and has just demonstrated it can churn.
None of that is visible in the headline, and all of it is visible in about ninety seconds of looking at the components. That ratio is why the habit is worth forming.
You should be able to answer each of these from memory before opening it. Recalling the answer is what makes it stick; recognizing it when you read it does not.
One can be broadly fine with a tight cluster of accounts in serious trouble, needing a few urgent senior interventions. The other can be uniformly mediocre with nothing acute, needing a change to how the whole book is run. The average describes both identically.
Which of the four levers is doing it: new, expansion, contraction or cancellation. Contraction dominant is a value problem in live accounts; cancellation dominant is a save motion that started too late; weak expansion is a growth gap wearing a retention number.
The divergence is the finding. It usually means either concentration risk sitting in one or two large accounts, or a long tail of small accounts churning quietly enough that nobody has raised it.
A book that is mostly healthy with a cluster of severe risk averages out to the same figure as a book that is uniformly mediocre. They need completely different work.
Contraction is a save motion. Cancellation is a save motion that started too late. Weak expansion is an expansion motion. One number, three responses.
Ten small at-risk accounts and one at-risk account carrying a fifth of your ARR are not the same problem, however similar the counts look.
See agents carry the repeatable work of GTM across sales, marketing, customer success, and RevOps. Every action prepared, reviewed, and recorded. Fictional data, real product.
Explore the demo