Show what the capacity was spent on
The return is hours recovered and where they went. How to model it honestly, and which half of the argument gets skipped.
The job
“I want to answer, with numbers, what we got for running agents.”
- Sales leaders
- RevOps
- Finance
The capacity argument is easy to make and easy to overstate. Hours recovered from administrative work is a real and measurable quantity, and it is also the half of the argument that proves nothing on its own: an hour saved and spent on more administration is not a return, it is a reallocation nobody chose.
The half that gets skipped is where the hours went. That is the number a board will ask about, and it is the one that requires a decision in advance rather than a measurement afterwards.
What it moves
- Manual hours reduced
- Pipeline created
- Forecast variance
The division of labour
What RevTech does, and where you decide
In the product
How to do it
- Step 1 of 4
Model it with your own figures
The ROI model on this site takes your headcount, your rates and your own estimates rather than a benchmark. Use it as the frame, and be honest about which input the result is most sensitive to — it is almost always the hours-per-week assumption, which is also the one nobody measures.
- Step 2 of 4
Measure credits against work, not against a budget
Credit usage breaks down by run, by team and by workflow. The useful read is cost per unit of work rather than total spend: a campaign that generated forty briefs and a campaign that generated four hundred should not be compared on their totals.
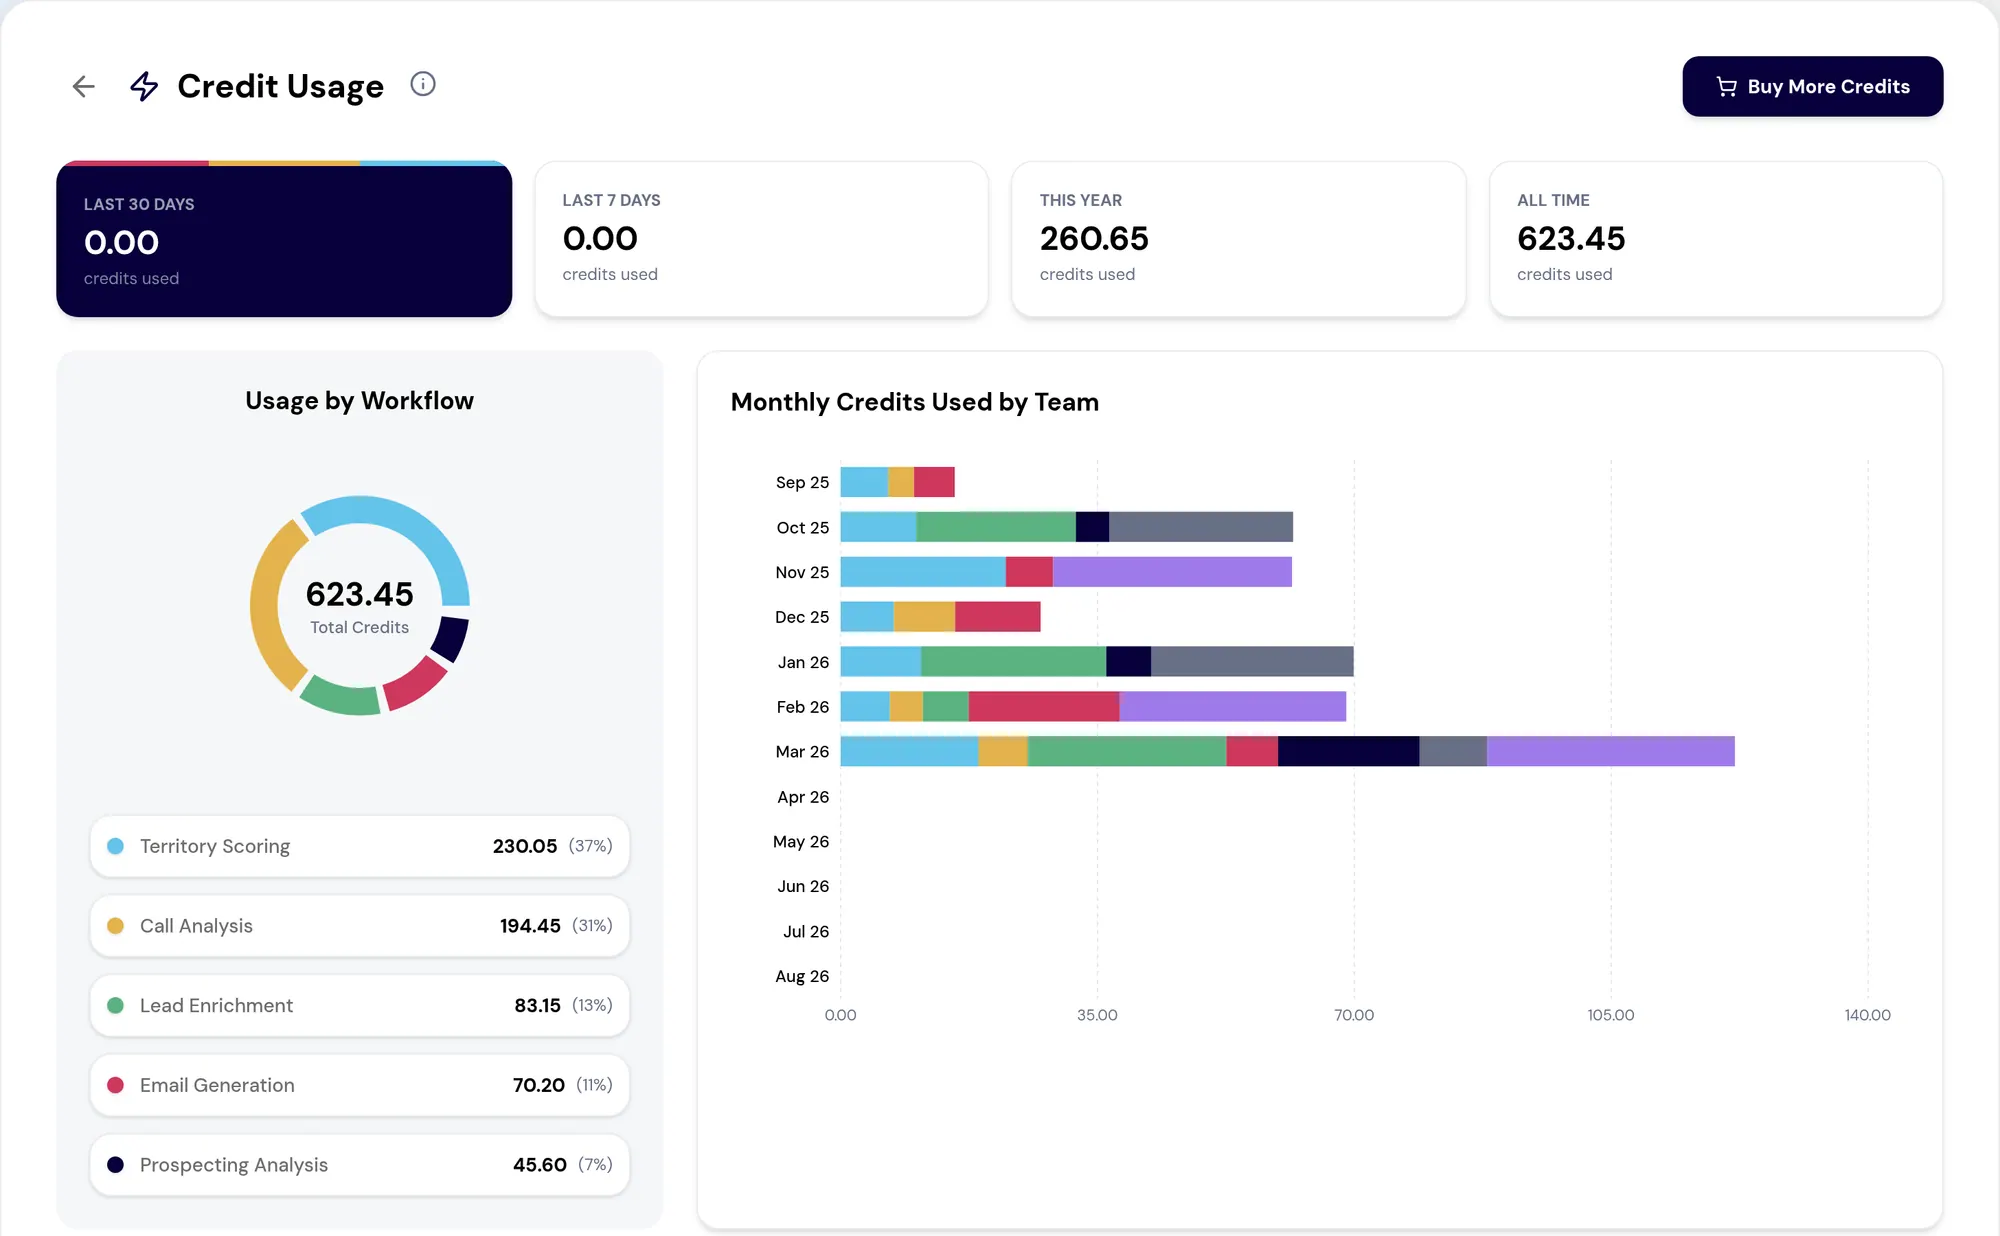
Credit usage broken down by workflow, team and individual run, giving agentic work the same cost visibility as any other system. Screenshot of the RevTech application; sample data. Runtime usage by workflow. The denominator for any honest cost-per-outcome read. - Step 3 of 4
Name where the hours went, before they are recovered
Decide in advance: more pipeline generation, more account coverage, fewer people doing the same work. A recovered hour with no destination is reabsorbed within a quarter and cannot be pointed at afterwards.
- Step 4 of 4
Separate service health from business outcomes
Acceptance rate, completion rate and exception volume tell you whether the system is working. Pipeline, win rate and retention tell you whether it mattered. Reporting the first set as if it were the second is the fastest way to lose an executive audience.
Where this is today
There is an ROI modelling surface inside the application, but it is not switched on for production tenants, so the model on this site is the one to use. Credit usage is a live report and is available.
What to take away
- Hours recovered is half the argument. Where they went is the half a board asks about.
- Decide the destination for the capacity before it exists, or it is quietly reabsorbed.
- Cost per unit of work, not total spend.
- Service health and business outcomes are two different reports. Do not present one as the other.
Go deeper
The material behind this
Try the demo.
See agents carry the repeatable work of GTM across sales, marketing, customer success, and RevOps. Every action prepared, reviewed, and recorded. Fictional data, real product.
Explore the demo