Blog
Explain a forecast change without losing the deal history
Why did the forecast move if the pipeline total barely changed?
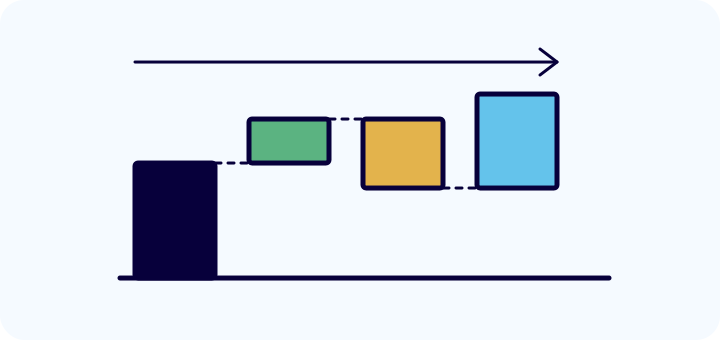
The forecast falls by $200,000 while total open pipeline rises. Sales says two deals slipped. Marketing points to new opportunities. The CRO needs to know what changed in the expected period, and neither total provides the explanation.
Build a forecast movement bridge from a preserved prior submission to the current submission under the same definition. Assign each change to a clear reason, preserve the deal-level evidence and reconcile the bridge exactly. Then discuss the few changes that alter leadership's choices. A movement bridge explains a changed view; forecast accuracy compares that view with a later outcome.
Define the view being reconciled
State the period, currency, included revenue motion and forecast method. A manager's submitted call is not necessarily the sum of opportunities in a CRM category. A probability-weighted calculation is different again. Use the same basis at both ends, or show a method change as its own explanation.
Preserve the prior view before editing current records. A live filter cannot recreate what the team knew last Monday if close dates, values and categories have since changed. Confirm that the necessary snapshots or histories actually exist. If they do not, label the reconstruction and its limits rather than presenting it as an exact historical submission.
Keep pipeline inventory beside the forecast, not inside the same bridge. New early-stage opportunities can increase pipeline without changing the current-period call. That is not a contradiction. The measures support different decisions.
Reconcile a fictional weekly movement
Suppose a fictional team's prior forecast is $1.50 million and its current forecast is $1.30 million. One previously included opportunity worth $300,000 moves outside the period. Another contributes $100,000 less after the buyer narrows scope. A newly supported opportunity adds $150,000. An existing opportunity's approved forecast contribution rises by $50,000.
| Bridge component | Forecast contribution |
|---|---|
| Prior forecast | $1,500,000 |
| Moved outside the period | −$300,000 |
| Reduced buyer scope | −$100,000 |
| Newly supported opportunity | +$150,000 |
| Increased existing contribution | +$50,000 |
| Current forecast | $1,300,000 |
The arithmetic is $1.50 million minus $300,000 minus $100,000 plus $150,000 plus $50,000, leaving $1.30 million. The bridge explains the $200,000 net reduction. It also exposes $400,000 of adverse movement partly offset by $200,000 of additions. Looking only at the net change would conceal the amount of underlying movement.
The manager's next questions differ by component. The slipped deal needs a current buyer timeline. The reduced scope needs an explanation of the buyer's decision. The new inclusion needs evidence that it belongs in the forecast. The increased contribution needs an accountable rationale. A single “pipeline improved” narrative would erase those distinctions.
All figures are illustrative. They demonstrate reconciliation, not a forecasting model or expected accuracy.
Prevent one deal from explaining the movement twice
An opportunity may change amount, close date and forecast category in the same week. Choose a documented attribution order for the arithmetic. For example, classify period entry or exit first using the prior contribution for exits, then explain value or contribution changes for opportunities present in both views.
Imagine a deal previously contributing $200,000 both falls to $150,000 and moves outside the period. Under the period-first convention, its current-period contribution falls by $200,000 in the exit category. Do not also subtract the $50,000 amount change from the current-period bridge. Preserve that amount change as secondary deal context or in the future-period view.
The convention is not a causal verdict. It is a reproducible way to reconcile overlapping changes. The underlying note should still explain both events when they matter. Different conventions can allocate components differently while producing the same net result; changing convention silently makes trend comparisons unreliable.
Keep corrections and judgment visible
A corrected duplicate, stale amount or wrong currency is not new selling performance. Separate record corrections from commercial movement. If a correction changes the historical baseline, retain the originally reported view and explain the restatement rather than quietly redrawing last week's chart.
Manager judgment may also produce a difference between the deal-level calculation and the submitted call. Show that adjustment explicitly, with the scope and rationale the organization permits. An unexplained balancing number can make the bridge add up while defeating its purpose.
If an amount cannot be reconciled, keep an unresolved line with an owner and a deadline. Do not label every unexplained difference “other” indefinitely. The reader should understand whether the gap is a missing snapshot, a changed definition or an unrecorded judgment. Each requires a different repair.
Turn the bridge into a decision
Use the largest consequential changes to choose where attention can help. A buyer-confirmed dependency blocked by your specialist capacity may justify a resource decision. A moved purchasing committee may require a revised expectation. Neither is fixed by asking the seller to restore the old date.
RevTech's Analyst Agent supports scheduled CRM questions about movement, coverage and change with supporting records. Scope a recurring bridge around the available historical inputs and approved calculation; current CRM connectivity alone does not promise a preserved submission history or a custom attribution convention.
For the next forecast call, bring both the reconciled movement and the buyer evidence behind its largest components. The CRO can then distinguish a changed commercial reality from a changed record and decide what the team can still influence.
Sources and scope
Original management-analysis method and fictional reconciliation, reviewed October 30, 2026. Current RevTech Analyst documentation supports the limited product scope. The existing fixed-horizon accuracy article covers the separate retrospective question of forecast versus actual.
Put the framework to work
Explore the operating model.
Forecast Accuracy at a Fixed Horizon
Compare forecasts with eventual results at a consistent horizon so accuracy reviews remain meaningful.
ExploreAnalyst Agent — Revenue Answers With Evidence
Explore revenue analysis that brings answers and supporting evidence into the review.
ExploreRevenue Intelligence
See how revenue reporting supports forecasts and operating decisions.
Explore

See how the work gets done.
Explore how agents prepare work across your revenue teams, and how people review it, guide it and decide what happens next. Fictional data. Real product.
Explore the demo