Blog
Review forecast accuracy at the same distance from quarter end
A last-day forecast and a six-week forecast did not face the same uncertainty.
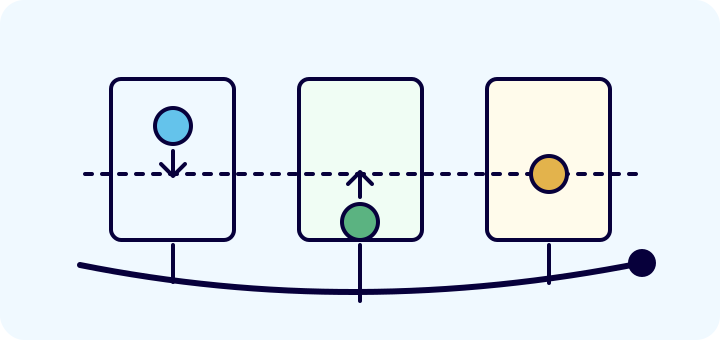
One manager finished the quarter within 2% of actual bookings. Another missed by 12%. The first number came from the final Thursday; the second came from six weeks earlier. Ranking the managers on those figures would reward the timing of the measurement as much as the quality of their judgment.
Review forecast accuracy at a consistent distance from period end. Preserve the submissions, use one actuals definition, and separate directional bias from the size of the error. Then inspect which assumptions were reasonable at the time and which information arrived later. The purpose is to improve a forecasting habit, not to reconstruct a perfect prediction after the outcome is known.
Choose the question before the score
Leadership may need to know whether a forecast was useful for an investment decision six weeks before quarter end, whether managers react promptly to new evidence, or whether the final call is reliable. Those are different questions and deserve different views.
Choose a few horizons that correspond to actual business decisions. For example, keep the latest valid submission as of six weeks, three weeks and one week before close. Define what happens when a submission is missing; show missing coverage instead of substituting a later forecast. Use the same cutoff convention in every period.
HubSpot’s forecast-accuracy documentation, updated May 29, 2026 and checked October 23, describes a view using closed-won amounts and the average of submissions for the selected period. That is useful product context. The fixed-horizon review proposed here is a separate analytical method: an average across submissions answers a different question from “What did we believe six weeks out?”
Keep bias visible beside absolute error
In a fictional example, North submitted $1.2 million six weeks before quarter end and closed $1 million. South submitted $800,000 and also closed $1 million. Define signed error as forecast minus actual. North’s error is positive $200,000; South’s is negative $200,000. Each has an absolute error of $200,000, or 20% of its actual bookings.
The combined forecast is $2 million and combined actuals are $2 million. The aggregate error is zero, but neither team was individually exact. Their errors canceled. A leader looking only at the company total would miss both the optimistic and conservative pattern.
Show signed error to understand direction and absolute error to understand magnitude. When using percentages, state the denominator and treat zero or very small actuals carefully. A currency error can remain meaningful where a percentage is undefined or unstable. Do not quietly remove a zero-booking period because it makes the chart inconvenient.
One period is not a stable tendency. Examine several comparable periods and preserve changes in motion, territory or scope. A manager taking over a different book should not inherit a misleading historical comparison simply because the team name stayed the same.
| Team | Forecast | Actual | Signed error | Absolute error / actual |
|---|---|---|---|---|
| North | $1.2m | $1.0m | +$0.2m | 20% |
| South | $0.8m | $1.0m | −$0.2m | 20% |
| Combined | $2.0m | $2.0m | $0 | 0% aggregate; team errors remain |
Explain the miss with the evidence that existed then
Start from the preserved forecast population. Separate opportunities expected to close that moved or were lost, deals that closed at a different amount, and business that arrived after the snapshot. Keep the actual definition consistent: bookings, recurring value and recognized revenue should not drift between the forecast and the outcome.
Then examine the few changes that explain most of the difference. For each, ask whether the relevant condition was known, knowable but unexamined, or genuinely new after the cutoff. A missed customer milestone visible at the time suggests a different improvement from an unexpected acquisition that stopped a purchase later.
Avoid making every miss a seller-confidence problem. The review may expose incomplete timing evidence, inconsistent category interpretation, late system updates or a plan that depended on one event outside the team’s control. The appropriate intervention follows the cause.
Improve one behavior without encouraging sandbagging
Suppose repeated six-week overcalls involve opportunities with no buyer-confirmed approval path. The change could be a manager review of that path before including the opportunity in the relevant submission. Test that behavior in the next comparable period and inspect whether the evidence improves.
Do not reward low forecasts simply because they are easy to beat. A forecast is useful when it describes the business as honestly as possible for the decision at hand. Keep performance targets and forecasting assessment distinct enough that people can communicate bad news without being told to change the estimate back.
RevTech’s Analyst Agent supports recurring CRM analysis with supporting evidence. A fixed-horizon review requires preserved historical inputs and an agreed calculation; it should not be assumed available merely because current pipeline data is connected. Confirm that scope before relying on automated preparation.
Bring the next retrospective three things: what was submitted at the chosen horizon, what actually happened under the same definition, and one forecasting behavior the evidence supports changing. That is a more useful result than a league table built from incomparable dates.
Put the framework to work
Explore the operating model.
Forecast disagreement rep model
Retrospective calibration across periods, not live disagreement on one deal.
ExploreAnalyst Agent
Review the current scope and responsibilities relevant to this article.
ExploreHubSpot: Track the accuracy of forecasts — updated May 29, 2026; checked October 23, 2026
Primary source for the specific factual context identified in the article.
Explore

See how the work gets done.
Explore how agents prepare work across your revenue teams, and how people review it, guide it and decide what happens next. Fictional data. Real product.
Explore the demo