Slide 1 of 4
Breach count measures the rules, not the process
It rises when you add rules and falls when you disable them. Both moves are under your control and neither says anything about hygiene.
Set up a measurement that tells you whether governance is working, rather than one that tells you how much it is finding.
Total breaches is the number everyone reaches for and it is close to uninterpretable, because it moves with things that have nothing to do with data quality. Add three rules and it rises. Disable one and it falls. Tighten a scope and it falls again. All three are changes to your measuring instrument, and none of them tells you whether the underlying process improved.
It is also perverse as an incentive. If breach count is the reported metric, the fastest way to improve it is to enforce less, which is exactly backwards, and it happens quietly because disabling a noisy rule always has a defensible justification at the time.
Record three figures at the same point every week: open breaches, new breaches arriving, and breaches resolved. Consistency of timing matters more than which day you choose, a Monday count and a Friday count differ systematically, and mixing them creates a trend that is an artefact of when you looked.
The diagnostic sits in the relationship between the second and third. When resolution outpaces arrival the backlog falls and the process is genuinely improving. When arrival outpaces resolution the backlog grows, and it does so regardless of how hard the team is working, which is the useful thing to be able to demonstrate, because it distinguishes a capacity problem from an effort problem.
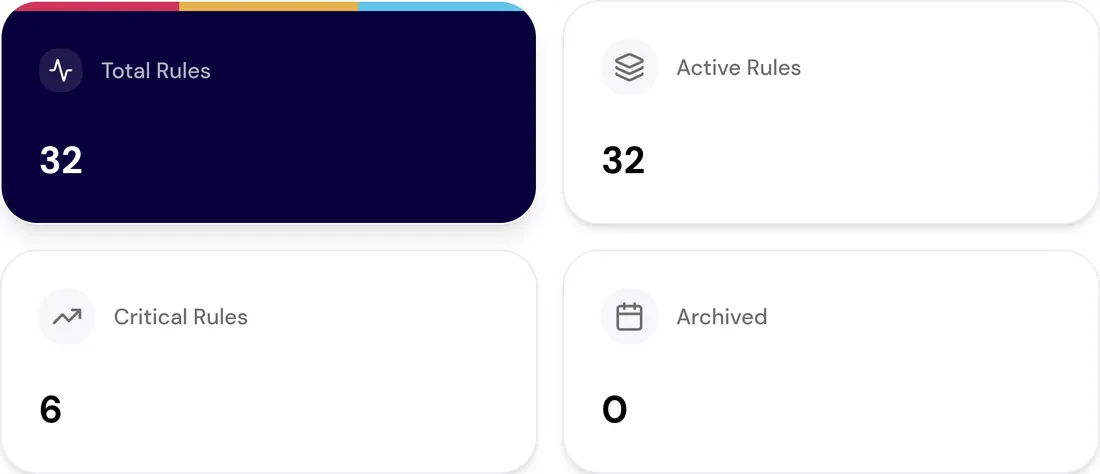
One more reading turns this from a trend into a diagnosis. A backlog that is stable in size can be composed of a fast-moving population that is being worked properly, or of a stuck segment quietly ageing while newer items are cleared around it. The total is identical in both cases and the situations are entirely different.
So look at the age of what is open, not just the count. A growing tail of old breaches means a specific category is not being worked, usually because it routes to an owner without capacity, or because a rule is producing exceptions nobody can actually resolve. Both are fixable, and neither is visible in a headline number.
Keep the record from the first week, including the rule changes. Six weeks of this is a far better argument about whether governance is working than any single snapshot, and it is the evidence you will want the first time someone asks whether the rules are worth the effort.
Do this in the product
You should be able to answer each of these from memory before opening it. Recalling the answer is what makes it stick; recognizing it when you read it does not.
It moves with changes to your measuring instrument. Add rules and it rises; disable one or tighten a scope and it falls. None of those say anything about whether the underlying process improved.
Arrival versus resolution. When resolution outpaces arrival the backlog falls and the process is improving; when arrival outpaces resolution it grows regardless of how hard the team works, which distinguishes a capacity problem from an effort problem.
A stuck segment aging quietly while newer items are cleared around it. Look at the age of what is open, not just the count.
It rises when you add rules and falls when you disable them. Both moves are under your control and neither says anything about hygiene.
Backlog falling means resolution outpaces arrival — the process is improving. Rising means the opposite, whatever the raw count does.
A stable backlog made of steadily older items is a queue with a stuck segment, and the total conceals it completely.
See agents carry the repeatable work of GTM across sales, marketing, customer success, and RevOps. Every action prepared, reviewed, and recorded. Fictional data, real product.
Explore the demo